


August Sales Blow Through Forecasts
Looking for a little clarity on this week's news? Windermere Chief Economist Matthew Gardner discusses how new home sales exceeded the annual rate of 1M units for the first time since 2006, blowing past most predictions.
https://bit.ly/3ijd2oh
Existing-home sales
First up: Existing-home sales numbers for August blew all forecasts out the water with a significant 2.4 percent jump in sales month over month, and the annual rate of sales breaking above 6 million units. That is really impressive.
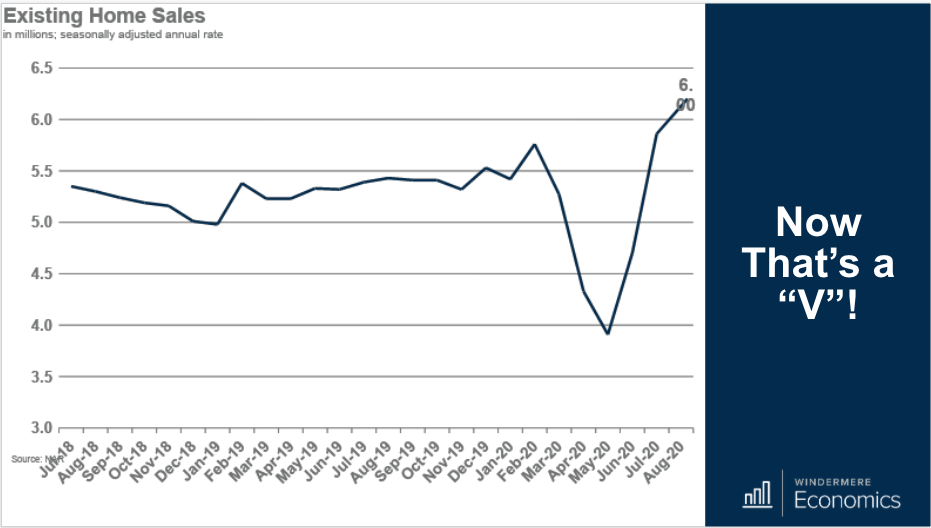
Total sales were up by a staggering 10.5 percent from a year ago, and that number is even more amazing because of this.
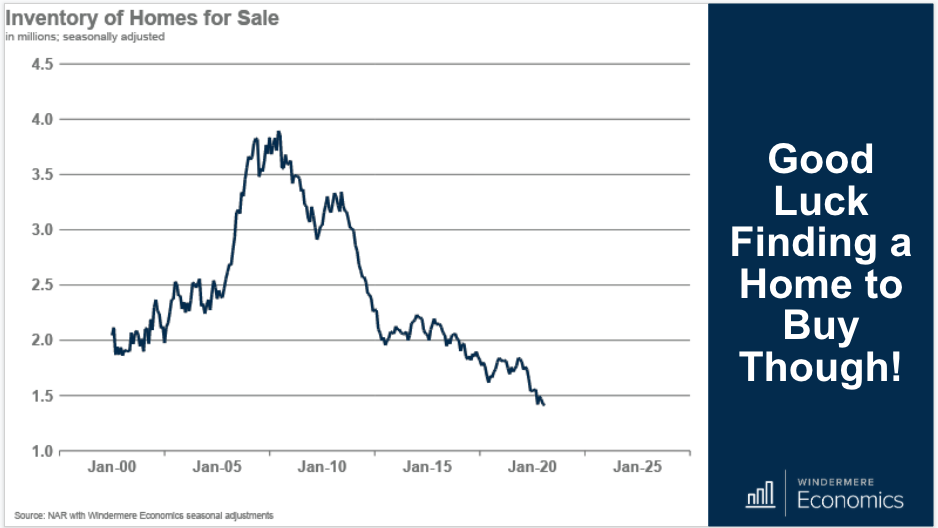
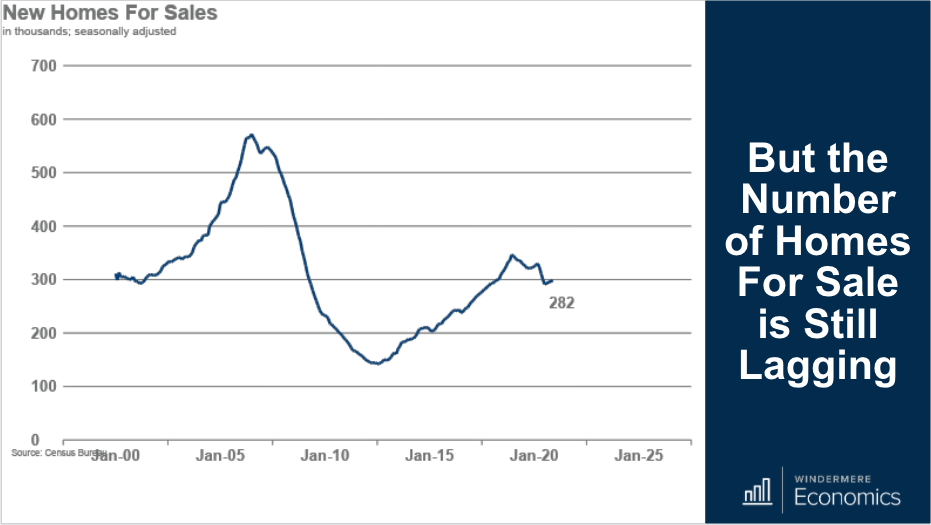
You see, sales rose even as the number of homes for sale continued to shrink. On an unadjusted basis, there were just 1.49 million homes for sale in August, and that’s down 0.7 percent month over month and 18.6 percent from a year ago.
But if you think that’s bad, I ran a seasonal adjustment model on the data, and it showed that the number of homes for sale in August dropped to just 1.41 million units — and that’s the lowest level of inventory I could find on record — and my numbers go back to 1999.
But of course, the inventory numbers are just a snapshot in time because they can exclude new listings coming on during the month.
So I pored through the data and found that 69 percent of homes that sold in August were on the market for less than a month, with properties typically selling in an average of just 22 days versus 31 days during the same month a year ago. So, even though inventory levels are very low, there are still homes coming to market. But they don’t show up in the figures because they are simply selling way too quickly.
The homes that remained on the market in August tell me that there’s just three months of supply at the current sales pace, and this is down from 3.1 months in July and four months in August of 2019. This is well below the six months of supply that’s typically associated with a balanced market.
I will add that first-time buyers are still responsible for one-third of all sales, and I believe that number — which is down from 34 percent in July — would actually be much higher if one thing was different, and that’s home prices.
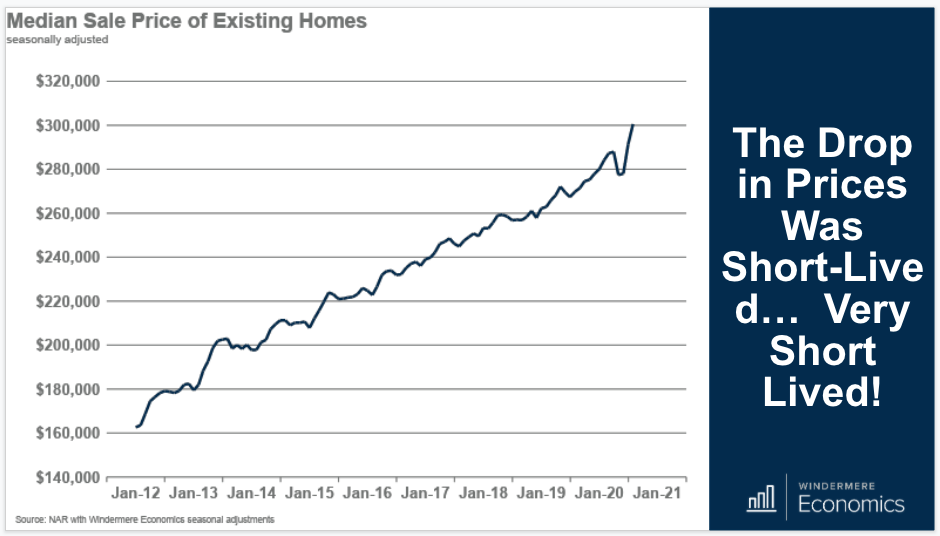
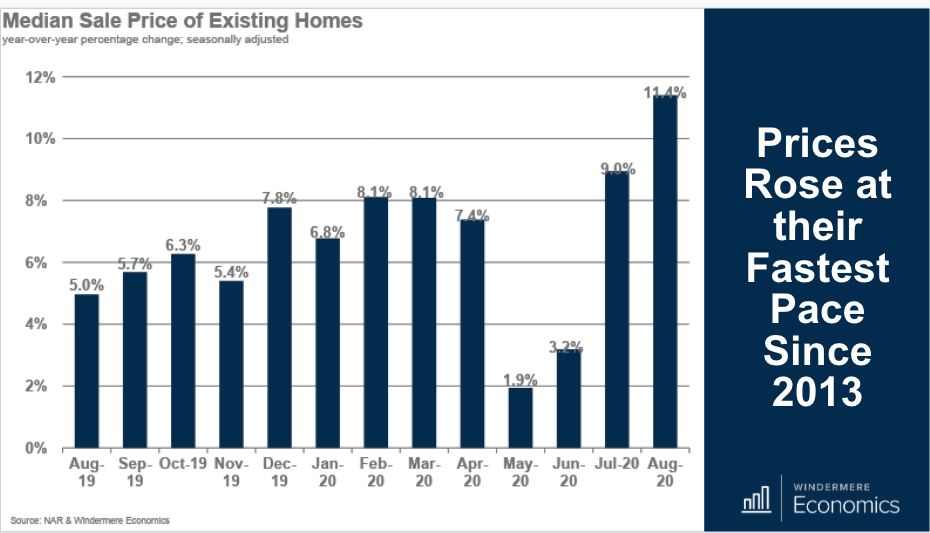
When we look at sale prices, the very modest pandemic-induced price drop you can see happened between April and May quickly turned around with the median sale price in August coming in at $310,600, but this chart shows the seasonally adjusted number which came in at $300,500.
And when we look at the annual percentage change in sale prices, which of course is the same for both seasonally adjusted as well as nominal prices, it’s up by a whopping 11.4 percent.
So, what’s going on?
Well, clearly there is belief in the housing market with the report showing very robust demand for existing homes, and this demand is limiting supply, which is pushing prices higher.
But there’s more.
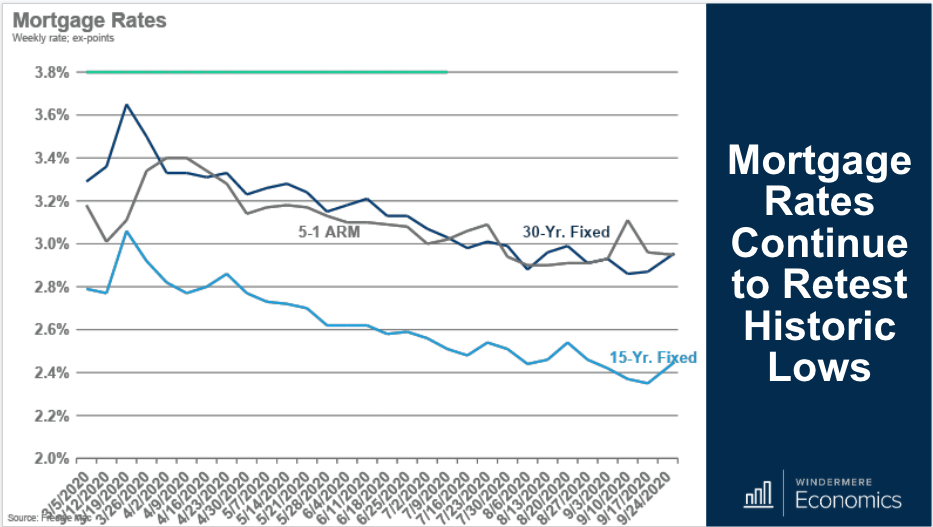
Mortgage rate data, which I look at weekly, shows rates remaining very competitive. This is, to an extent, allowing home prices to continue to rise at above average rates. However, there isn’t much room for them to drop further.
But before you get worried about me saying that, although I don’t believe it’s likely we will see rates move significantly lower, I also don’t see rates rising significantly either. Any upward pressure on rates won’t happen this year, and I’m not expecting to see much of a move higher in 2021 either.
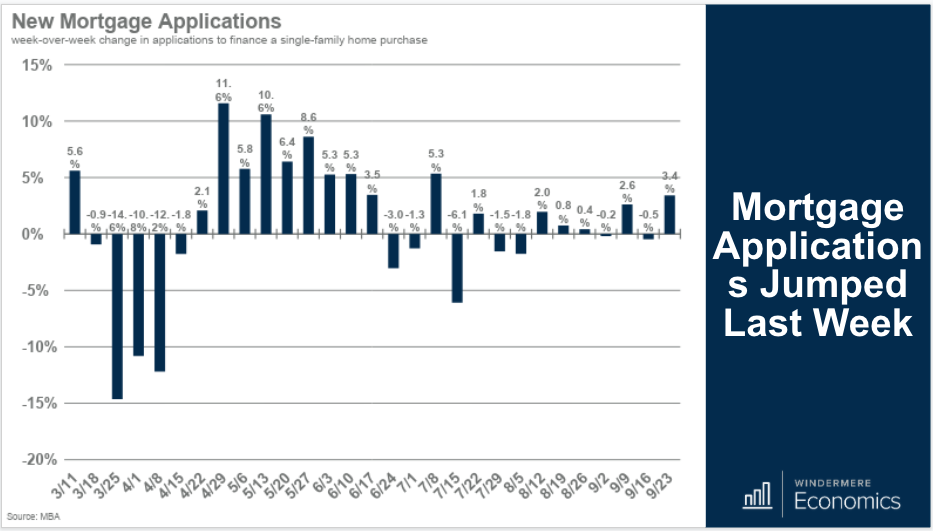
Demand for housing is also supported by last week’s mortgage application numbers, which rose by 3.4 percent on the week and are now 25.1 percent higher than a year ago. But I am showing you this for another reason, and it’s that the purchase index is now at a level we haven’t seen since October of 2008.
So, it’s clear that existing homes sales are on fire with solid demand supported by very low borrowing costs. Pretty impressive. And regular viewers of my videos will know that I have been attributing some of the buoyancy in the resale market to a lack of new construction, and as luck would have it, we got the August number on new home sales last week too, so let’s take a look at those.
New home sales
Another “wow” moment. New home sales in August did something they haven’t done since November of 2006 — and that’s exceeding an annual rate of 1 million units. More precisely, they rose 4.8 percent month over month to 1.011 million sales and were up 43.2 percent year over year.
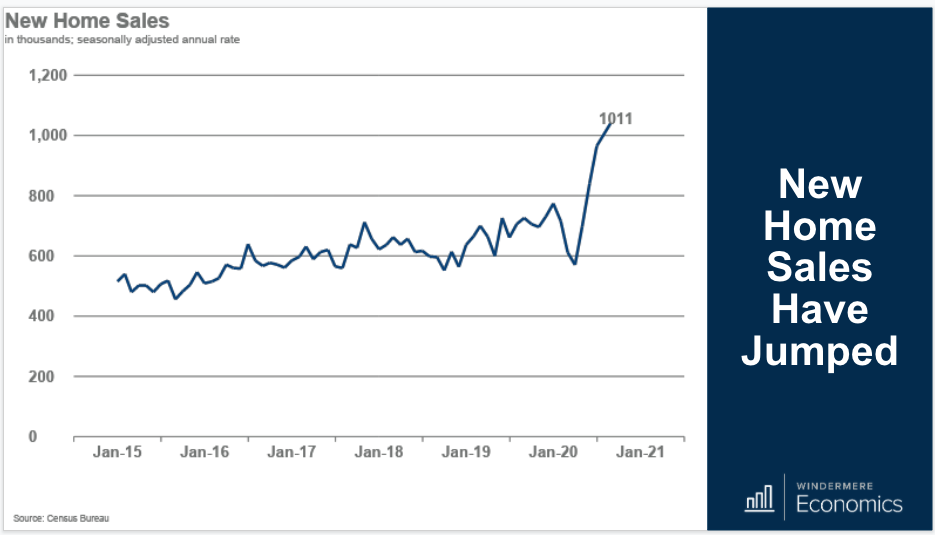
This number totally blew through everyone’s forecasts — including mine — as I was expecting the number to come in at around 890 thousand.
But if I do have a concern, it’s supply, which turned lower with only 282,000 units for sale at the end of August, and only 51,000 of those are actually completed and ready to move into.
Some of you might remember my video from last week. I told you about the massive increase in lumber prices that builders are having to cope with and that these numbers might be an indicator that increased costs are starting to impact supply. But, with that said, we did see single-family starts rise to their highest level since February of this year, so the data is still a little opaque.
New home sale prices are interesting, but not for the reasons you might expect. Builders can change the type of homes they build to meet demand and also hit a price point, and that can show up as prices actually dropping, which isn’t entirely accurate.
The data showed a big jump in sales of homes prices between $200,000 and $300,000 and an almost equally large drop in sales of homes priced between $300,000 and $400,000, and this can obviously impact the pace of price increases.
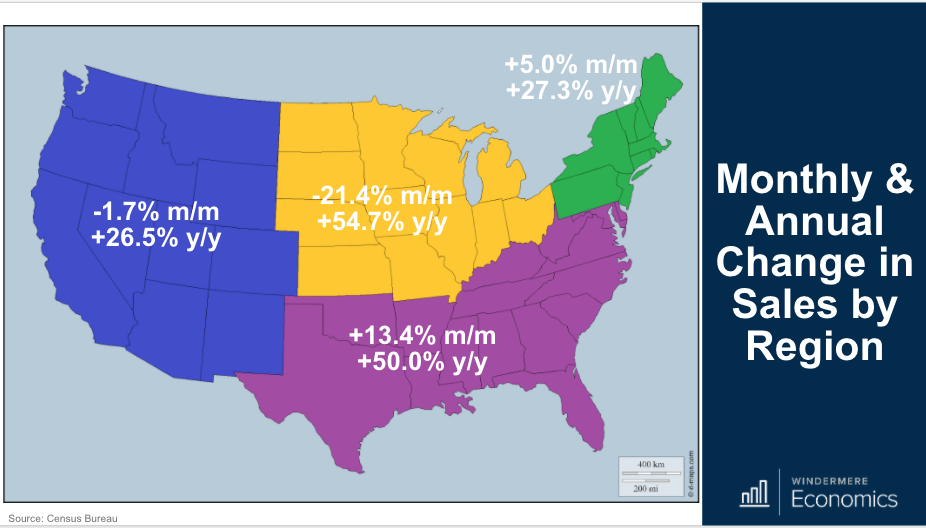
This theory is also supported when we look at sales by region, with solid demand at more affordable price points. As you see here, sales were up massively month over month in the South, which is not only the largest homebuilding region by volume, but it also has the lowest average home prices.
So, there you have my thoughts on last week’s data releases.
In all, the reports were very solid and show housing as being the shining light in an economy that is still mired by the COVID-19 pandemic.
Looking ahead, this Tuesday, we will get the Case-Shiller data for July and also the September Consumer Confidence numbers. Pending homes sales data for August is released on Wednesday, but all eyes will be on Friday’s jobs report that will tell us what was going on in the labor market in the month of September.
Again, all interesting releases, so I hope you’ll join me again next Monday when I will give you my take on all of the numbers.
To get the big picture including all of the data, watch the full video above.
Matthew Gardner is the chief economist for Windermere Real Estate, the second largest regional real estate company in the nation. https://bit.ly/3ijd2oh