


Regional Snapshot
Here’s how existing-home sales fared across the country in May:
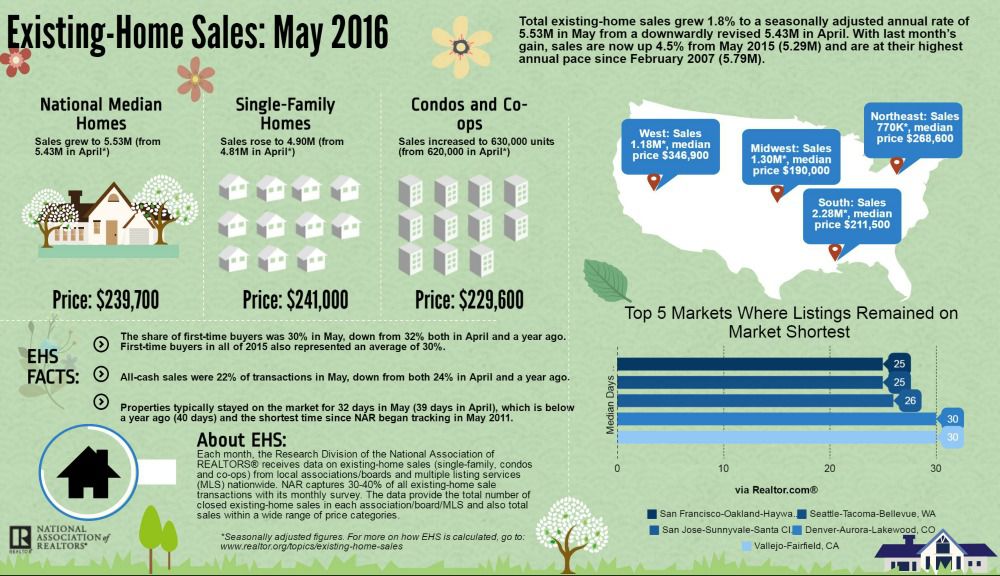
- Northeast: existing-home sales rose 4.1 percent to an annual rate of 770,000, and are now 11.6 percent above a year ago. Median price: $268,600, which is 0.1 percent below May 2015.
- Midwest: existing-home sales fell 6.5 percent to an annual rate of 1.3 million in May but are still 3.2 percent higher than a year ago. Median price: $190,000, up 4.8 percent from a year ago.
- South: existing-home sales rose 4.6 percent to an annual rate of 2.28 million in May and are now 6.5 percent above a year ago. Median price: $211,500, up 5.9 percent from a year ago.
- West: existing-home sales climbed 5.4 percent to an annual rate of 1.18 million in May but are still 1.7 percent lower than a year ago. Median price: $346,900, which is 7.7 percent above a year ago.
- Housing inventories: Total housing inventory at the end of May increased 1.4 percent month-over-month to 2.15 million existing homes for sale. That is 5.7 percent lower than a year ago. At the current sales pace, unsold inventory represents a 4.7-month supply.
"Existing inventory remains subdued throughout much of the country and continues to lag even last year's deficient amount," says Yun. "While new-home construction has thankfully crept higher so far this year, there's still a glaring need for even more, to help alleviate the supply pressures that are severely limiting choices and pushing prices out of reach for plenty of prospective first-time buyers."
-
All-cash sales: Buyers paying in cash accounted for 22 percent of all transactions in May, down from 24 percent a year ago. Individual investors account for the biggest bulk of all-cash sales. Investors purchased 13 percent of homes in May, down from 14 percent a year ago.
-
Distressed sale Foreclosures and short sales dropped to 6 percent of all sales last month, down from 10 percent a year ago. Foreclosures comprised 5 percent of sales in May while short sales represented 1 percent of sales. On average, foreclosures sold for a discount of 12 percent below market value while short sales were discounted 11 percent.
-
Days on the market: Properties spent less time on the market in May, selling, on average, after 32 days. That's below the average time on market a year ago (40 days) and the shortest time since NAR began tracking such data in May 2011. Forty-nine percent of homes sold in May were on the market for less than a month, also the highest percentage since May 2011. Short sales were on the market the longest, at a median of 103 days in May, while foreclosures sold in 51 days. Non-distressed homes took 30 days.
Realtor.com Article


